
Master GoodData Dashboards: Build & Share Insights Fast
Focused View
47:23
1 -Course Overview.mp4
01:16
2 -Introduction.mp4
01:39
3 -GoodData Overview.mp4
04:50
4 -Data Visualization Basics.mp4
01:30
5 -Data Sources.mp4
01:28
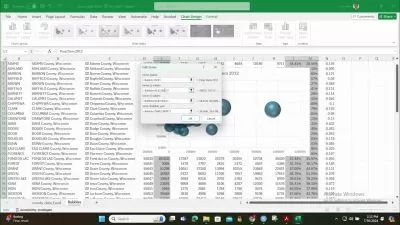
6 -Dashboard Scenario COVID-19 Pandemic.mp4
06:59
7 -Creating Your First Metrics.mp4
06:39
8 -Creating Some Simple Headline Insights.mp4
01:49
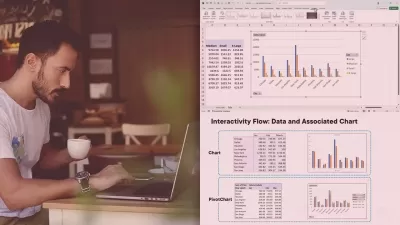
9 -Adding Insights and KPIs to Dashboards.mp4
04:51
10 -Building out the Case Detail Dashboard.mp4
11:52
11 -Sharing GoodData Dashboards.mp4
04:30
More details
Course Overview
This course teaches you to create powerful GoodData dashboards that provide actionable insights into your organization's operations. Learn to load data, build metrics, and share visualizations in this hands-on guide.
What You'll Learn
- How to load and prepare data in GoodData
- Create custom metrics for data analysis
- Build and share interactive dashboards
Who This Is For
- Data analysts transitioning to GoodData
- Business intelligence professionals
- Team leads needing operational insights
Key Benefits
- Transform raw data into visual insights
- Share dashboards across your organization
- Practical COVID-19 dashboard case study
Curriculum Highlights
- GoodData fundamentals & visualization basics
- Creating metrics and headline insights
- Dashboard building and sharing techniques
Focused display
Category
- language english
- Training sessions 11
- duration 47:23
- level preliminary
- Release Date 2025/06/07