
Master Power BI & R Integration: Advanced Data Science 2024
Focused View
6:55:15
1 -Installing R CRAN and MRAN.mp4
04:20
2 -Installing MRO DEMO.mp4
01:03
3 -Setting Up The IDE.mp4
00:39
4 -Installing RTVS DEMO.mp4
02:28
5 -RTVS Settings DEMO.mp4
09:28
6 -Solutions and Projects in RTVS DEMO.mp4
12:42
7 -Configuring Power BI To Work With R.mp4
00:45
1 -Important R Objects.mp4
00:26
2 -Atomic Vectors.mp4
10:29
3 -Augmented Vectors.mp4
05:58
4 -Lists.mp4
03:32
5 -Data Frames.mp4
08:44
1 -Methods To Read Data Into Power BI Using R.mp4
02:11
2 -Readr and Readxl Packages To Bring Data Into PowerBI DEMO.mp4
12:39
3 -PREVIEW String Manipulations In R DEMO.mp4
05:15
4 -RODBC Package To Bring data Into PowerBI DEMO.mp4
09:55
5 -Data.Table and Purr Packages To Combine Data Files DEMO.mp4
09:34
6 -Combining Multiple Files Using Magrittr Package DEMO.mp4
14:29
7 -Combining Excel Worksheets with ReadXL Package DEMO.mp4
10:28
1 -Dplyr Introduction.mp4
04:50
2 -Inner And Left Joins.mp4
08:35
3 -Joining Data With Different Column Names DEMO.mp4
02:08
4 -Filtering Data in R DEMO.mp4
06:04
5 -Selecting Columns From A Data Frame in R DEMO.mp4
10:05
6 -Summarizing Data in R DEMO.mp4
06:10
7 -Mutate Verb to Create New Columns in R DEMO.mp4
04:05
1 -TIDY Data Introduction.mp4
02:58
2 -TIDY Data DEMO.mp4
07:17
1 -StringR Introduction.mp4
03:32
2 -Count Words Within A Text String DEMO.mp4
08:58
3 -Identify Valid Email Addresses DEMO.mp4
13:55
4 -Remove Numbers From A String DEMO.mp4
11:45
5 -Conditional Replacements DEMO.mp4
07:13
6 -Overview Of Functions In R.mp4
02:33
7 -ReScaling Data DEMO.mp4
06:06
8 -Calculate Distance Using A Custom Function.mp4
05:36
9 -Calculate Distance Using Geosphere Package DEMO.mp4
06:17
10 -Create Custom Visualizations with GGPLOT2.mp4
02:26
11 -Simple Chart Using GGPLOT2.mp4
10:20
12 -Additional Components.mp4
01:15
13 -Chart Scales and Labels in R DEMO.mp4
07:13
14 -Available Graphing Options.mp4
03:01
15 -Why Facet Charts are Beneficial.mp4
03:40
16 -Create Facet Charts in R DEMO.mp4
05:32
17 -Pretty Up Your Facet Charts In R DEMO.mp4
03:59
18 -CRISP-DM.mp4
02:54
19 -Popular Algorithms.mp4
10:54
20 -Text Analytics.mp4
02:11
21 -Logistic Regression Model in R DEMO.mp4
36:29
22 -Testing Your Model In PowerBI DEMO.mp4
10:57
23 -Introduction To Demos.mp4
02:55
24 -Big Data with R and SQL Server DEMO.mp4
16:59
25 -Scoring Data with SQL Server DEMO.mp4
10:46
26 -Using Tools in SQL Server for Larger Data Sets.mp4
13:37
27 -Stored Procedure Using Native Scoring DEMO.mp4
01:41
28 -Native Scoring DEMO.mp4
10:37
29 -Cognitive Services DEMO.mp4
14:37
More details
Course Overview
This comprehensive course teaches you to combine Power BI's visualization power with R's statistical analysis to create dynamic dashboards, predictive models, and actionable business insights.
What You'll Learn
- Integrate Power BI dashboards with R's advanced analytics
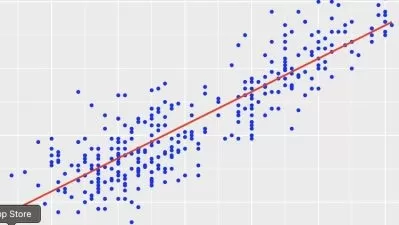
- Build predictive models and perform statistical forecasting
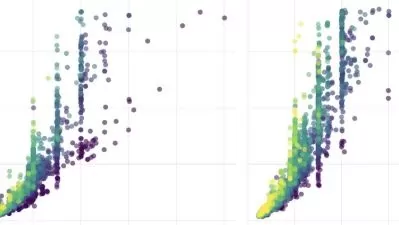
- Create custom visualizations using ggplot2 in Power BI
Who This Is For
- Data scientists wanting to enhance Power BI capabilities
- Business analysts seeking advanced analytics skills
- Power BI users looking to incorporate R programming
Key Benefits
- No advanced R experience required
- Hands-on projects with real-world applications
- Master the complete data science workflow
Curriculum Highlights
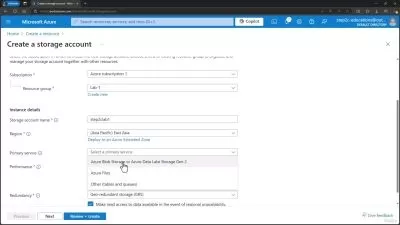
- Setting up R-Power BI integration
- Data manipulation with dplyr and tidyverse
- Advanced analytics and custom visualizations
Focused display
Category
- language english
- Training sessions 57
- duration 6:55:15
- Release Date 2025/04/26